The Galileo performance is reported in the Galileo Initial Services – Open Service – Quarterly Performance Report, where several key performance indicators are analysed according to criteria (Minimum Performance Levels, MPLs) defined in the Galileo Service Definition document (SDD), published in the European GNSS Service Centre and last updated in May 2019.

Galileo performance reports, which measure the system’s performance against Minimum Performance Levels, are published on a quarterly basis.
As planned, recently the GSA published the Q3 2019 performance report. This report covers the period when a technical incident caused by an equipment malfunction in Galileo last July resulted in a six-day interruption in Galileo navigation and timing services. This had an important effect on the programme and, following the incident, an independent Inquiry Board was set up by the European Commission to investigate its causes and to make recommendations for actions to avoid another such incident in the future.
Performance measurement: how is it done?
Measurement of service performance is one of the key activities of the GSA, the Galileo Service Provider. The GSA’s Galileo Reference Centre, located in Noordwijk, the Netherlands, plays a crucial role in monitoring the Galileo performance .
The Galileo Reference Centre (GRC) is one of the Galileo Service Facilities and it supports the provision of services to Galileo users. The GRC is operated by the GSA, providing an independent means of evaluating the performance of the Galileo Service Operator and the quality of the signals in space. The GRC is fully independent of the system and the Galileo Service Operator with respect to both the technical solution and operations, and consists of both a core facility and contributions available in EU Member States, Norway and Switzerland. Data and products from cooperating entities in the Member States make it possible to observe the Galileo signals all over the world at all times, in support of both routine operations and specific performance assessment campaigns.
The minimum performance levels
The MPLs address several parameters of interest, and can be mainly grouped into two categories:
-
Accuracy MPLs refer to how well (accurately) the Galileo services perform, whenever the Galileo signals are usable (or “healthy”, as defined in the SDD). This includes:
- Ranging Accuracy; related to the navigation data transmitted by the satellites which is used to calculate the distance between the satellite and the receiver;
- Timing and Frequency Accuracy; related to the parameters that allow the receiver to obtain a precise synchronisation to either Universal Time Coordinated (UTC) or GPS time.
Accuracy MPLs are statistically defined as “95th percentile”, and calculated over a period of 30 days, using a sample of measurements taken every 5 minutes and considering only those epochs where the signals were healthy. In line with other GNSS constellation providers, timing parameters are normalised over a year by averaging the past twelve 30-day periods. For accuracy parameters, the smaller the achieved value, the better.
-
Availability MPLs refer to how much time per month (or year) a given performance level is to be met (for which the signals have to be healthy). This includes:
- Per-Slot Availability; related to the amount of time per period that the signals from each satellite are healthy;
- Timing Availability; related to the amount of time per period that the timing parameters are broadcast, and the time synchronisation error is within the specified target;
- Positioning Availability; related to the amount of time per period that the users have enough satellites in view to calculate their position, and the calculated position error is within the specified target.
Availability MPLs are reported as percent, and calculated over a period of 30 days, using a sample of measurements taken every 5 minutes and considering all epochs (healthy or not). Again, in line with other GNSS constellation providers, some parameters are normalised over a year by averaging the past twelve 30-day periods (timing and per-slot availability). For availability parameters, the larger the achieved value, the better.
The Service Definition Document also describes how to assess whether the Galileo signals are healthy or not, by looking into some parameters (“flags”) transmitted by the satellites, and checking the last time when the navigation data was refreshed (it should not be older than 4 hours).
The Galileo performance in Q3 2019
The Galileo system is currently in a partial deployment stage, with some satellites still to be launched and a number of ground infrastructure upgrades on-going to provide redundancy and complete all functionalities. For this reason, the MPL commitments published in the SDD include margins that account for possible planned and unplanned outages. The quarterly performance reports provide visibility on the measured performance and compare it with the MPL. Galileo has regularly performed well above the MPL targets since the declaration of Initial Services in 2016.
The Galileo incident in July 2019 prevented the refresh of the data transmitted by the satellites, therefore eventually the signals were flagged as not healthy and/or the data became outdated. This caused an impact on the availability MPLs that are calculated monthly. These parameters went well below the values typically provided by Galileo, yet in most of the cases (all but two) they stayed above the committed figure, which includes margins for the reasons explained above. The performance report, therefore, displays them as “green” in the dashboard, however the trend chart clearly shows the difference with the months of June and August and the margin with the MPL.
An example is provided below (Figure 12 of the Quarterly Performance Report Q3 2019, page 19) for the positioning availability:
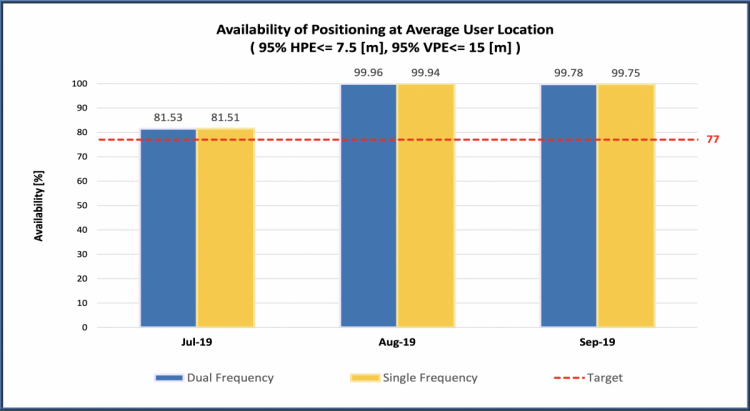
The committed value (MPL) is 77%. Due to the incident in July, the signals were not available for some days and the parameter was only met 81% of the time, whereas in August and September it was met well above 99%. Still, all values are above the target.
Another example (Figure 16 of the Quarterly Performance Report Q3 2019, page 13) for the time determination availability:
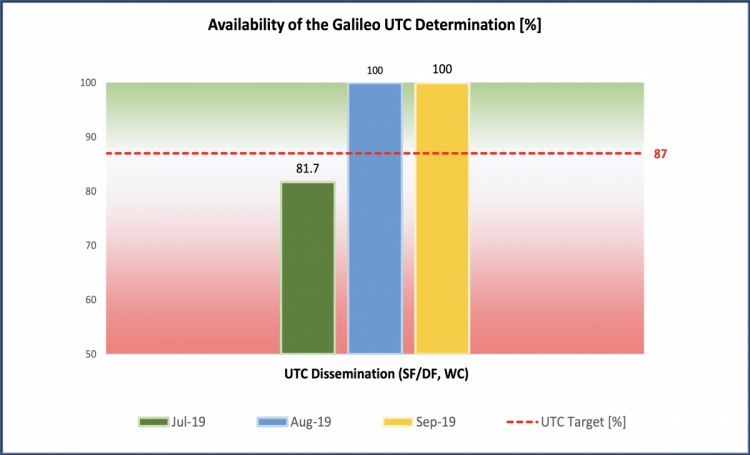
In this case, the committed value (MPL) is 87%. Due to the incident in July, the parameter was only met 81% of the time therefore not fulfilling the target, whereas in August and September it was met 100%.
During the 3rd quarter of 2019, whenever the signals were Healthy, they provided good performance. Therefore, the accuracy MPLs were fulfilled despite the incident.
An example is provided below (Figure 2 of the Quarterly Performance Report Q3 2019, page 10) for the ranging accuracy:
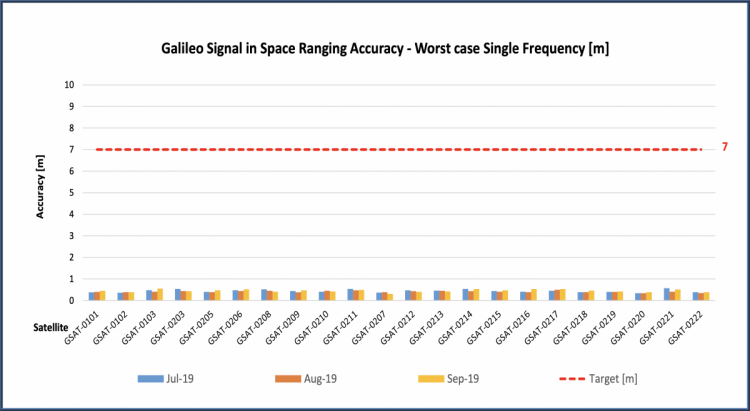
The committed value (MPL) is 7 meters, 95%. During July, August and September, 95% of the time where the signals were healthy the error was below 0.5 meters for all satellites. Therefore, the target was largely met.
Next steps
Regardless of the fact that the published MPLs were mostly met due to a proper estimation of the margins associated to the current deployment status, the programme fully recognises the magnitude of the service outage, and is working consistently on actions to increase Galileo’s stability, robustness and resilience. This will translate into a future update of the Service Definition Document, including more stringent commitments with lower margins, and the reporting of the delivered performance according to the new MPLs.
Media note: This feature can be republished without charge provided the European GNSS Agency (GSA) is acknowledged as the source at the top or the bottom of the story. You must request permission before you use any of the photographs on the site. If you republish, we would be grateful if you could link back to the GSA website (http://www.gsa.europa.eu).